56
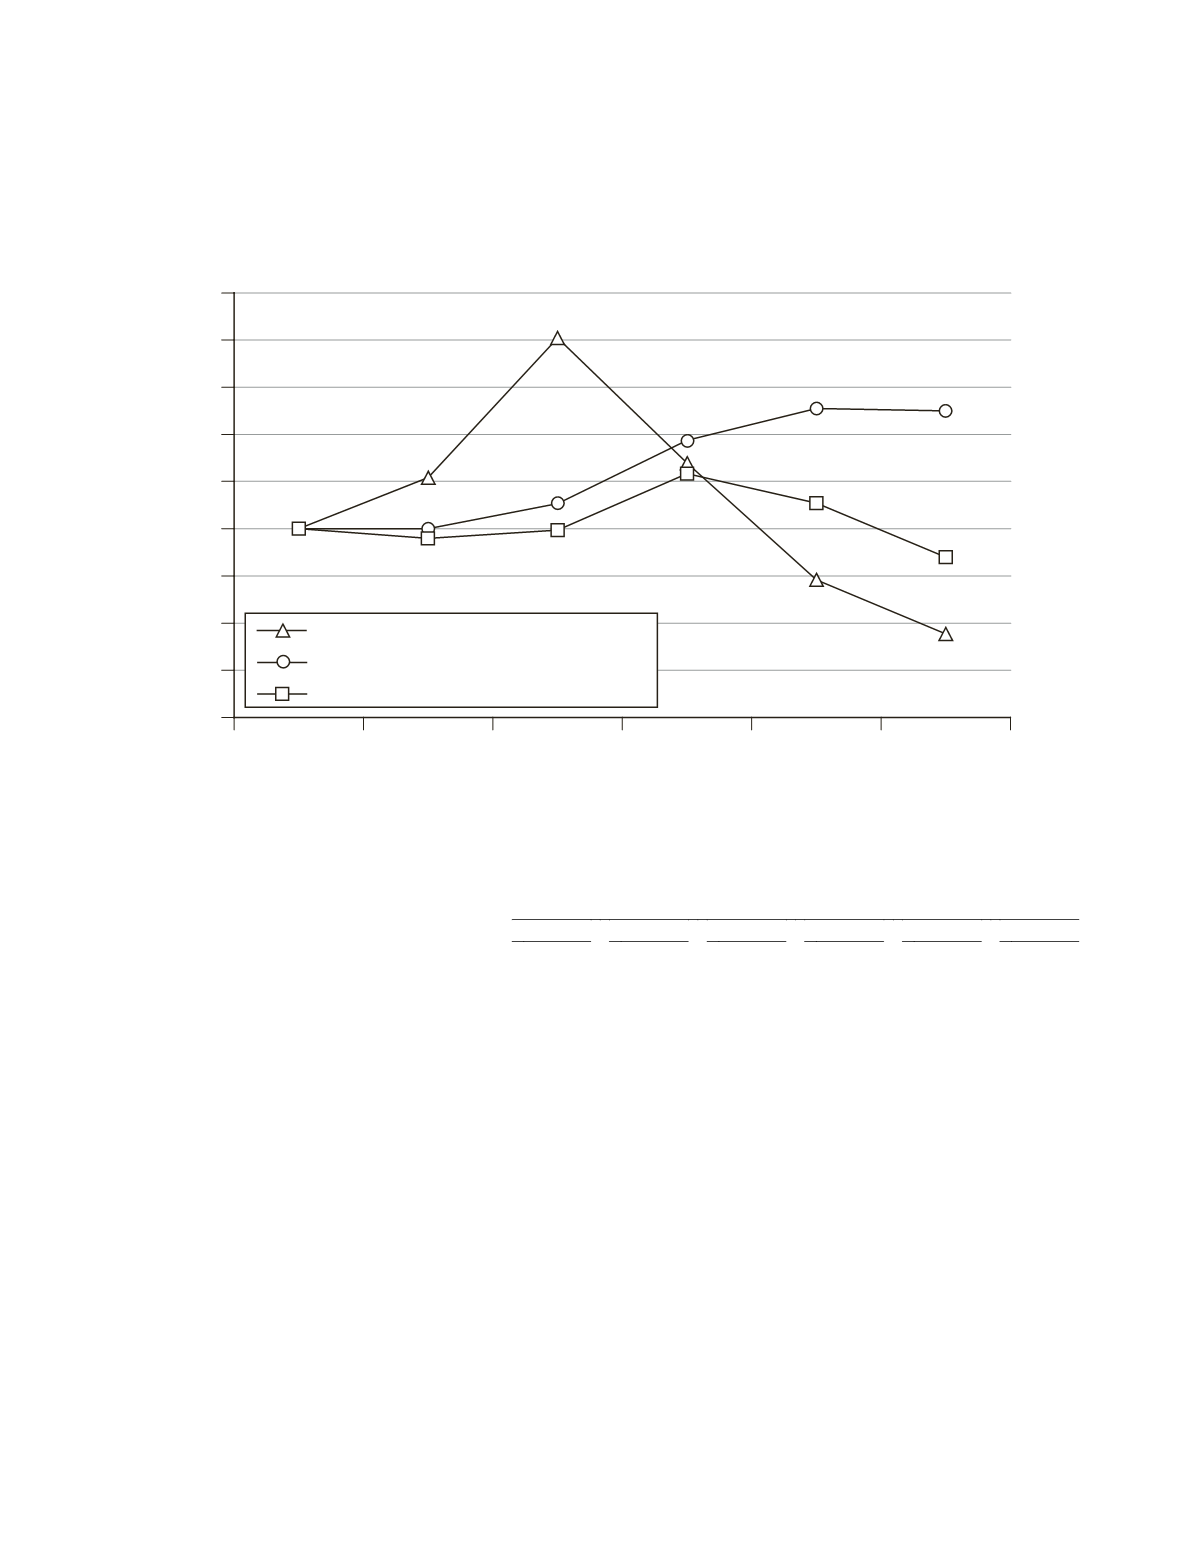
The following stock price performance graph is intended to allow review of stockholder returns, expressed in terms of the
appreciation of our common stock relative to two broad-based stock performance indices. The information is included for historical
comparative purposes only and should not be considered indicative of future stock performance. The graph compares the yearly
percentage change in the cumulative total stockholder return on our common stock with the cumulative total return of the Standard &
Poor’s Composite 500 Stock Index and of the Dow Jones U.S. Exploration & Production Index (formerly Dow Jones Secondary Oil
Stock Index) from December 16, 2010, the date we commenced trading on the New York Stock Exchange, through December 31,
2015.
An investment of $100 is assumed to have been made in our common stock, in the S&P’s Composite 500 Stock Index (with
reinvestment of all dividends) and in the Dow Jones U.S. Exploration & Production Index on December 16, 2010, and its relative
performance is tracked through December 31, 2015:
Year Ended December 31,
2010
2011
2012
2013
2014
2015
Cobalt International Energy, Inc. ......................... $ 100.00 $ 127.11 $ 201.15 $ 134.73 $ 72.81 $ 44.23
S&P's Composite 500 Stock Index....................... 100.00 100.00 113.40 146.97 163.71 162.52
Dow Jones U.S. Exploration & Production
Index.................................................................. 100.00
95.00
99.36 129.29 113.63
85.03
Holders
As of December 31, 2015, there were approximately 194 holders of record of our common stock. The number of record holders
does not include holders of shares in “street names” or persons, partnerships, associations, corporations or other entities identified in
security position listings maintained by depositories.
Dividend Policy
At the present time, we intend to retain all of our future earnings, if any, generated by our operations for the development and
growth of our business. The decision to pay dividends on our common stock is at the discretion of our board of directors and depends
on our financial condition, results of operations, capital requirements and other factors that our board of directors deems relevant.
2010
2011
2012
2013
2014
2015
0
25
50
75
100
125
150
175
200
225
Cobalt International Energy
S&P’s Composite 500 Stock Index
DJ US Expl. & Prod. Index


